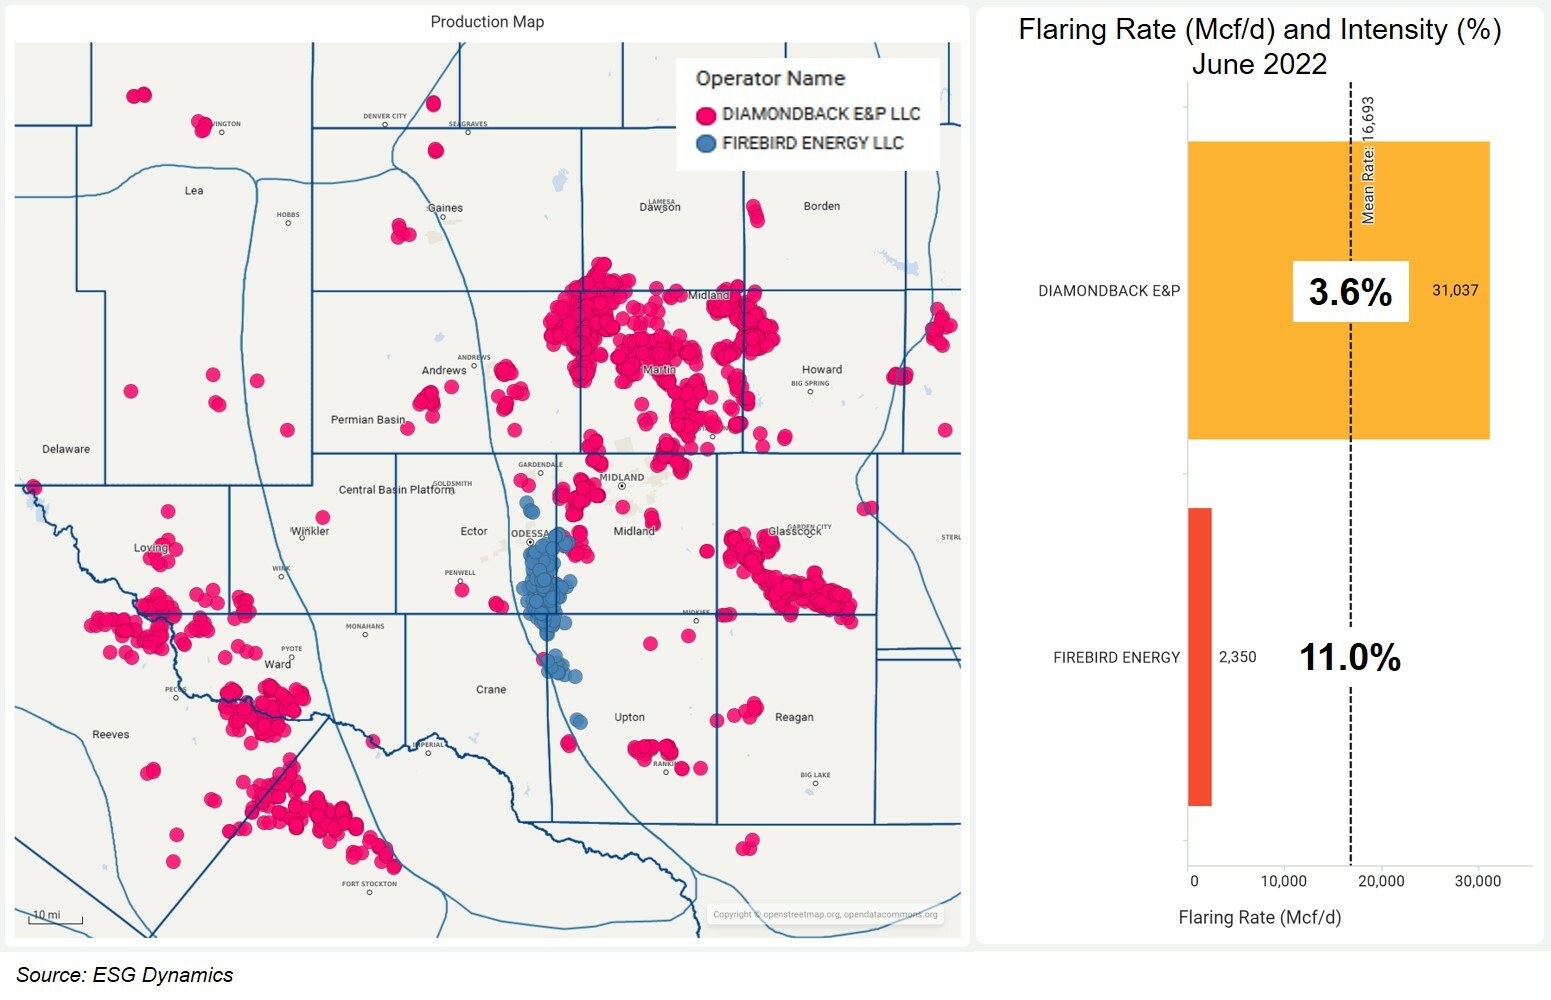
Diamondback Energy continues to grow through a string of Permian Basin acquisitions. On October 11th, it announced that it would buy FireBird Energy’s assets, which includes 22 Mboe/d production and 38,000 acres in the western Midland Basin. FireBird bought more than half of that acreage from Chevron just a year ago.
Valued at $1.6 billion in cash plus FANG stock, the deal should close in Q4 2022. According to Diamondback’s press release, “this transaction is accretive on all relevant 2023 and 2024 financial metrics”. But is the purchase ESG-accretive? Oil and gas companies ought to consider this question, in light of growing disclosures and attention from investors, regulators and the public.
Company-reported public data reveals Diamondback may face additional costs to remediate FireBird’s environmental footprint, potentially lowering the value of the transaction. We also investigate how Diamondback performed on several ESG metrics after its 2018 and 2021 acquisitions of Ajax, Energen, Guidon and QEP.
Why wait until after a transaction to discover environmental issues? ESG Dynamics’ Due Diligence services helps operators like Diamondback with early environmental due diligence, to understand environmental performance before making a deal, to factor in the total asset costs.
Firing up the flares
The public, investors and operators now focus on reducing gas flaring in the oilfield. An industry standard has emerged to flare less than 1% of natural gas produced, known as flaring intensity. This acquisition stands out because both companies exceed that mark, according to public data.
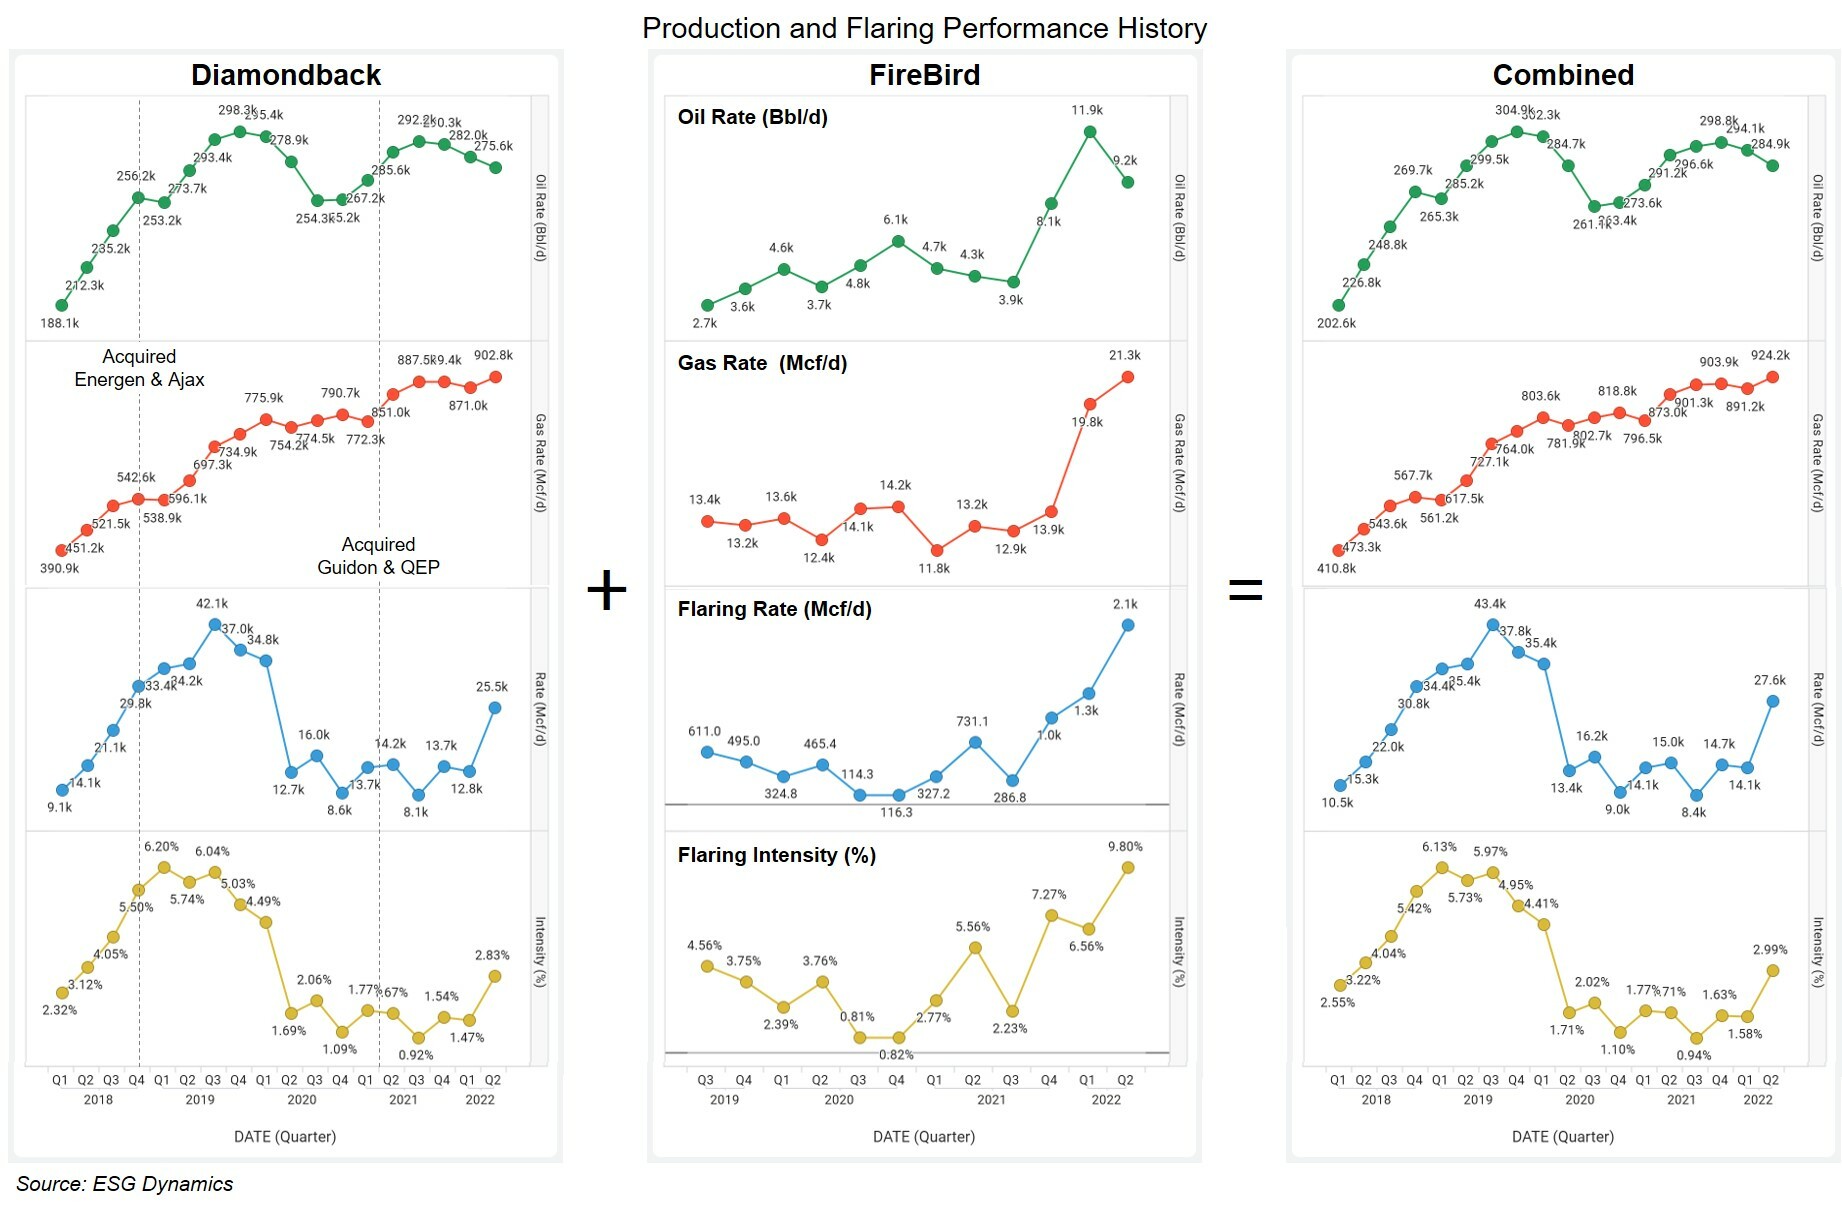
Diamondback has steadily raised production over the past five years, originally increasing flaring in tandem. Both flaring rate and intensity dropped precipitously with pandemic-induced shut-ins during April 2020. The company held flaring intensity flat at 1 to 2% until mid-2022. Flaring suddenly jumped in May, reaching 3.5% intensity on last report in June, dominantly from Reeves and Midland counties.
FireBird shows a more concerning pattern of flaring. With slowly climbing production, it cut flaring rates until late 2020, reaching less than 1% by mid-year. But in 2021 it reversed the trend, burning increasing volumes of gas. Adding new acreage in late 2021, FireBird sharply increased production. Flaring intensity skyrocketed to 11.2% by June 2022.
It’s not uncommon for small operators to drive up production without regard for flaring as they seek to be acquired. Perhaps new completions exceed their capital or capacity to lay new gas flowlines. We saw the same pattern from Validus in the Eagle Ford, as it prepared for its recent sale to Devon. Publicly-traded acquirers face added cost and effort to mitigate high flaring rates.
Indeed, we anticipate Diamondback would cut flaring and improve the environmental footprint of these assets. Transferring emissions from private to public companies can yield reductions, as the new operator pursues stronger ESG commitments to satisfy stakeholders.
Mixed flaring record on past acquisitions
Diamondback has been on a buying-spree, absorbing four new companies prior to FireBird since 2018. Has the larger public operator improved environmental metrics on those assets?
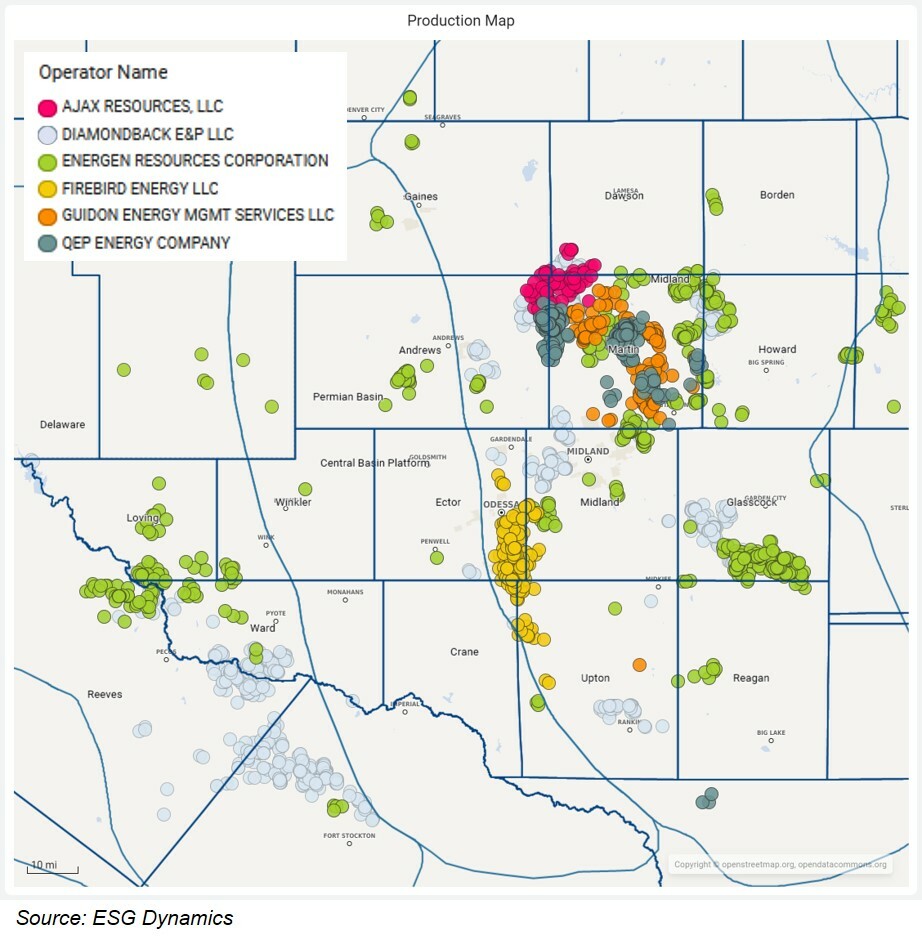
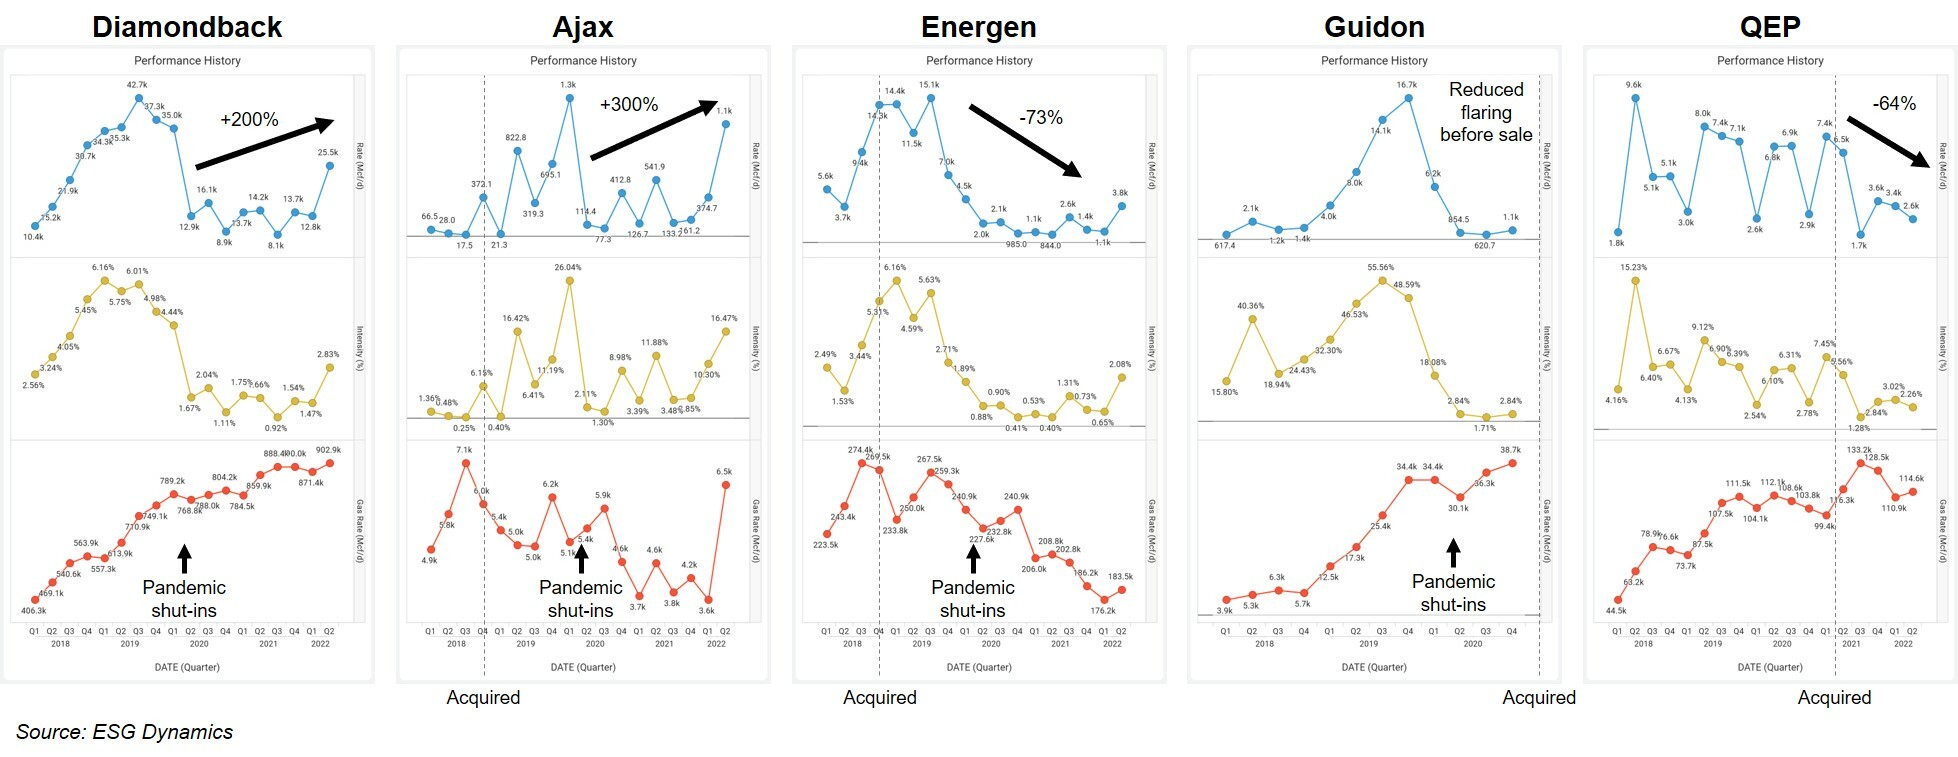
Diamondback cut flaring rates and intensity from peak levels across most of the acquisitions. Significant decreases resulted from pandemic-induced production cuts in 2020. Flaring continued to rise at former Ajax and Energen properties for about a year after the deals closed, with insufficient Permian gas pipeline capacity until Q2 2019. Both acquisitions saw flaring jump in Q2 2022, with Ajax rates three times the level at closing. Only former QEP properties log continuous flaring reductions since acquisition.
Targeting GHG emissions
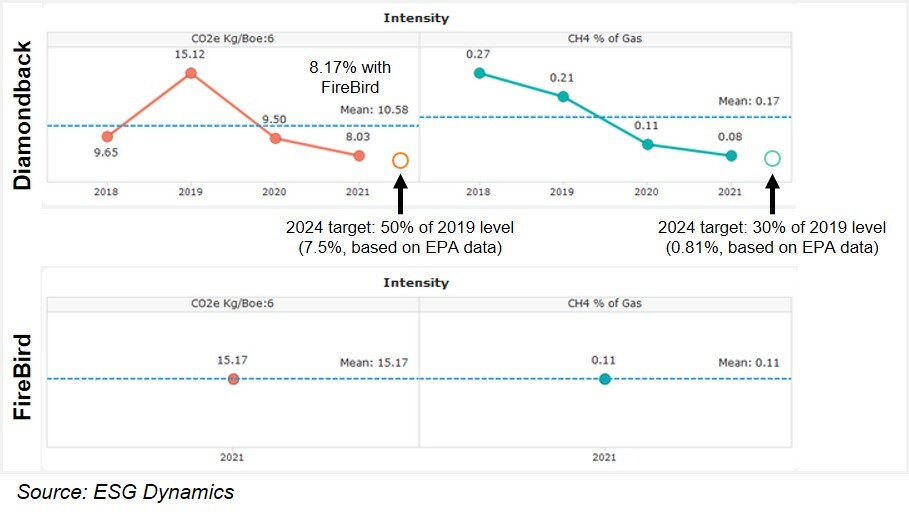
Diamondback outlines several emissions-related targets in its 2022 corporate sustainability report. In 2022, the company aspires to flare less than 1% of gross produced gas. By 2024, it intends to reduce total greenhouse gas (GHG) emissions intensity by 50% and methane intensity by 70% from 2019 levels.
Diamondback will be hard-pressed to reach its 2022 target below 1% flaring intensity. This metric consistently exceeded that level during the first half of the year, except in March. Flaring rates tripled in May and June, raising intensity over 3.5%. The addition of FireBird assets with makes achieving that goal even harder. Diamondback will need to increase gas production with near zero flaring in H2 to achieve its annual target.
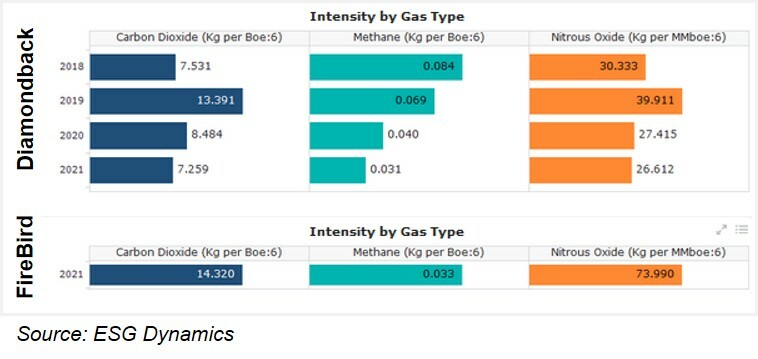
The company appears to be on track to meet its GHG emissions targets over the next two years, based on data reported to the EPA. FireBird first reported emissions data in 2021, contributing 0.14 CO2e Kg/Boe at half of current production rates. The acquisition could represent a 3% bump in CO2 equivalent emissions, minor compared to Diamondbacks broader goal.
ESG Dynamics oil & gas data analytics platform provides a clear view of the latest reported greenhouse gas emissions data, to generate actionable insights. The new forecasting tool enables quick scenario analysis, for easy and impactful modeling of company or competitor emissions.
FireBird’s reported nitrous oxide emissions intensity (74 Kg/MMboe) is 2.8 times higher than Diamondback’s. This gas may be overlooked due to small releases volumes, but N2O has global warming potential 298 time greater than CO2. According to the EPA, it can remain in the atmosphere for 114 years before breaking down (compared to 12 years for methane). Electrification of operations could address the 80% of Firebird’s nitrous oxide emissions from combustion equipment, while flaring reductions would limit the remainder.
Stopping emissions at the source
Creating an action plan for GHG emissions reductions requires understanding which operations and equipment produce those emissions.
Fortunately for Diamondback, the top carbon dioxide emissions sources for the two companies are the same: combustion equipment and flare stacks. Diamondbacks current initiatives – to cut flaring by improving gas takeaway and to replace combustion with electrified equipment – would work effectively for both asset bases.
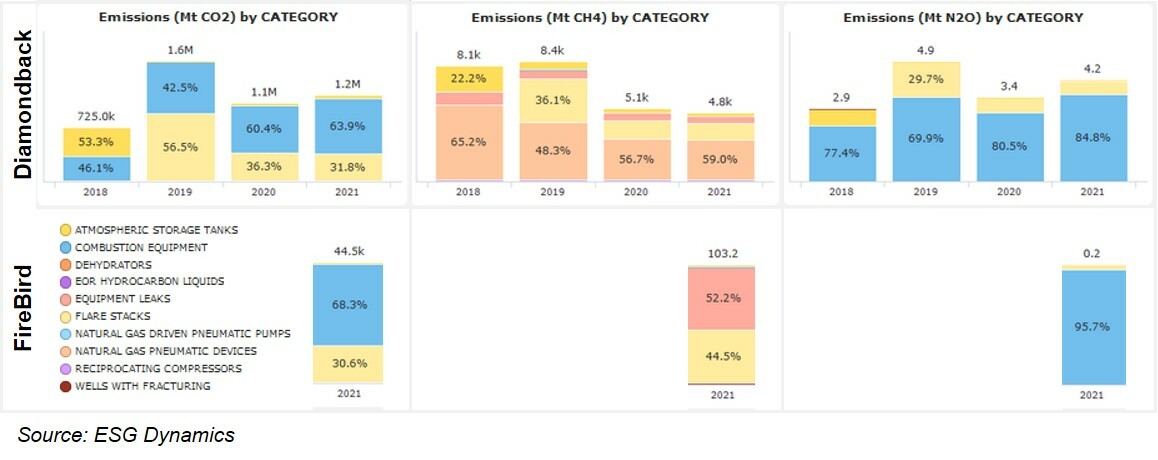
More-potent methane emissions sources differ. Half of FireBird’s methane emissions result from equipment leaks, while flare stacks cause most of the remainder. Diamondback’s plan tackles its own top sources: natural gas pneumatic devices and atmospheric storage tanks. The operator also installed continuous monitoring systems to combat equipment leaks in many of its facilities, but would need to expand the program across Firebird properties if it hopes to reach its 90% coverage goal by year end 2023. Cutting methane emissions at FireBird flare stacks means new attention to ensure proper ignition and function.
Reducing GHG emissions and flaring intensity can be achieved, but each acquisition complicates ESG action plans and increases the cost of reaching these worthwhile targets.
Get our take on your next deal
Contact us at info@esg-dynamics.com to learn about our oil and gas Environmental Advisory Practice. Or ask to see our environmental data analytics platform in action. We’re here to help with environmental compliance and environmental benchmarking, to quickly identify concerns so you’ll be ready for upcoming deals, capital raise or ESG messaging.